Turning Continuous Customer Feedback Into Product Strategy
Stop being a reactive feature factory. Learn how to build an insight pipeline to filter customer feedback by ICP and make strategic roadmap decisions.

Product Leader Academy
PM Education

Your Slack channel #product-feedback has 400 unread messages. Sales insists that closing an $80,000 ARR deal requires a custom CSV export tool. Support logged 60 tickets this week about missing bulk editing. You have mountains of customer data, yet your roadmap looks like a list of disconnected feature requests.
Most product teams confuse listening to customers with executing a strategy. When feedback flows directly into a backlog without a strategic filter, you become a reactive feature factory. You fix local paper cuts while your product's core value proposition degrades.
Transforming continuous customer feedback into strategic impact requires an insight pipeline: a system that filters raw input by Ideal Customer Profile (ICP) fit, clusters user pain into strategic opportunity areas, and weights qualitative evidence with product telemetry before prioritizing a single line of code.
Here is how to build that pipeline and shift your product team from a reactive listening post to a proactive strategic engine.
1. The Continuous Feedback Trap (Why Teams Drown in Data)
1.1 Reactive vs. Proactive Feedback Loops
Raw feedback gives you symptoms, not root causes. When a user asks for an export button, they are describing a local workaround, not their underlying problem.
- User Request (Raw Input): "We need an automated CSV export button on the dashboard."
- Strategic Signal (Underlying Problem): "Weekly reporting takes 45 minutes because cross-account data cannot be aggregated inside the product."
If you build the export button, you solve a symptom while adding interface clutter. If you build multi-account data aggregation, you eliminate the operational friction entirely and increase platform stickiness.
Reactive feedback loops trap product managers in symptom-fixing. Proactive loops use raw customer requests as entry points to investigate user workflows.
1.2 The "Loudest Customer" and Non-ICP Bias
Not all feedback carries equal weight. A $10,000 SMB customer shouting on social media or a $150,000 legacy account demanding custom functionality can easily hijack your engineering resources.
Building features for non-ICP accounts creates two long-term liabilities:
- Product Bloat: Specialized workflows built for non-target users confuse your target persona.
- Resource Starvation: Engineering hours spent servicing edge cases reduce velocity on core platform differentiators.
| Feedback Type | Strategic Action |
|---|---|
| High Volume / Non-ICP Account | Distraction (Ignore or Decline) |
| Low Volume / High-ICP Account | Strategic Signal (Investigate) |
If a request originates from an account outside your strategic ICP, log it, track its frequency, but keep it off your core roadmap.
1.3 Shifting Mindsets: From Listening Post to Strategic Engine
Product leaders cannot operate as passive order-takers. Your role as an Orchestrator PM is to balance customer discovery with product vision.
Vision-Led Strategy (Where we are going) + Continuous Discovery (Where friction exists today) = Outcome-Based Roadmap
Your strategy defines the destination; continuous feedback identifies the obstacles along that path. Feedback informs how you achieve your strategic goals—it does not dictate what those goals should be.
2. Building a Scalable Insight Ingestion Pipeline
2.1 Establishing a Single Source of Truth
Scattershot feedback across Gong calls, Intercom chats, Zendesk tickets, and user interviews guarantees missed signals. You need a centralized repository—whether using specialized tools like Dovetail or Productboard, or a custom warehouse setup—with rigid metadata tagging.
Every piece of incoming feedback must carry standardized metadata before it hits your synthesis queue:
| Metadata Tag | Options / Scale | Strategic Purpose |
|---|---|---|
| Persona | Admin, Power User, Executive Buyer | Distinguishes end-user usability friction from buyer economic priorities. |
| ICP Fit Score | Tier 1 Target, Tier 2 Secondary, Non-ICP | Filters out requests from accounts outside your target market. |
| Account ARR | Numerical ($ Value) | Weights feedback impact against financial exposure. |
| Journey Stage | Onboarding, Retention, Expansion, Churn Risk | Connects qualitative pain to specific lifecycle drop-off points. |
| Product Area | Search, Billing, Reporting, Core Workflow | Directs insights to the responsible product squad. |
2.2 Leveraging AI for First-Pass Processing
Modern LLM workflows allow product teams to automate initial ingestion without sacrificing human context. Use automated pipelines for:
- Transcript Summarization: Extracting key pain points, feature requests, and workflow blockers from sales and research calls.
- Metadata Categorization: Tagging transcripts against pre-defined taxonomy categories (e.g., product area, sentiment, persona).
- Cluster Identification: Grouping recurring semantic themes across hundreds of qualitative text entries.
The Boundary Line: AI handles taxonomy, extraction, and initial clustering. Humans handle synthesis, trade-off evaluation, and strategic alignment. Never let an automated script define your roadmap priorities.
2.3 Setting Up Continuous Discovery Rhythms
Avoid episodic discovery, where research occurs only during quarterly planning. Implement continuous habits across your product squads:
- Weekly Interview Cadence: Every squad conducts 2 to 3 user interviews weekly, regardless of current development cycles.
- Shared Shadowing: Engineers and designers join at least one live customer interview or support call review per week.
- Weekly Insight Triage: Spend 30 minutes every Monday categorizing new incoming raw inputs into opportunity buckets.
3. The Synthesis Framework: Turning Qualitative Noise into Strategic Signals
3.1 Mapping Feedback to Opportunity Solution Trees
To prevent feedback from turning into a feature list, map qualitative inputs directly to business outcomes using Opportunity Solution Trees (OST).
- Desired Business Outcome: Increase 30-Day Active User Retention by 15%
- Opportunity Area 1: Users struggle to invite team members during setup
- Feedback Input A: "I don't know who has admin permissions." (12 ICP accounts)
- Feedback Input B: "The invite modal errors on CSV upload." (34 support tickets)
- [Targeted Solution]: Pre-build role templates and automated team invites.
- Opportunity Area 2: First-time reporting setup takes too long
- Feedback Input C: "I have to manually configure metrics." (8 Enterprise deals)
- [Targeted Solution]: Provide industry-specific template dashboards.
- Opportunity Area 1: Users struggle to invite team members during setup
By organizing raw customer feedback under clear Opportunity Areas, you evaluate solutions against a defined business outcome rather than shipping isolated user requests.
3.2 Triangulating Qualitative Data with Telemetry
Never rely on customer statements in isolation. Validate what users say against telemetry showing what users do.
Practical Triangulation Case Example
A B2B analytics platform noticed a 14% retention drop during month two.
- Qualitative Data (Interviews): Users claimed, "The custom dashboard builder is missing advanced filtering options."
- Quantitative Telemetry (Product Analytics): 78% of drop-off accounts had never saved a single dashboard template during onboarding.
- Synthesis: The problem was not missing advanced features. The initial setup friction was so high that users abandoned the workflow before reaching the builder interface.
- Outcome: The team simplified the onboarding configuration workflow instead of adding complex filters. Retention recovered by 11%.
3.3 Defining Evidence Confidence Scores
Assign an Evidence Confidence Score to every proposed roadmap item based on the quality and volume of supporting data:
| Confidence Score | Required Evidence Criteria | Roadmap Status |
|---|---|---|
| Score 1 (Low) | Single user request or non-ICP feedback; unsupported by analytics. | Backlog / Backburner |
| Score 2 (Emerging) | Multiple user requests (3-5 users); inconsistent telemetry signals. | Requires Discovery Research |
| Score 3 (Moderate) | 10+ target ICP requests; verified friction point in usage telemetry. | Candidate for Prototype Testing |
| Score 4 (High) | Validated across 20+ ICP accounts; corroborated by funnel drop-offs; prototype usability tested. | Ready for Delivery Prioritization |
| Score 5 (Very High) | Statistically significant A/B test results or extensive multi-method research across enterprise ICPs. | High-Priority Commit |
4. Translating Customer Insights into Product Strategy and Roadmaps
4.1 Moving from Feature Backlogs to Outcome-Based Themes
Executive teams and board members do not need to see a list of 45 granular JIRA tickets. Present your roadmap organized by strategic themes mapped directly to synthesized customer opportunities.
Traditional Backlog (Feature-Driven):
- Add bulk export to CSV
- Add SAML SSO integration
- Fix team management permissions modal
- Update table search filters
Strategic Roadmap (Outcome-Driven):
- Theme 1: Enterprise Account Security & Governance (Target: Unblock Enterprise ARR)
- Theme 2: Accelerated Time-to-First-Value (Target: Increase 30-Day Retention)
- Theme 3: Self-Serve Reporting Workflows (Target: Reduce Onboarding Support Volume)
4.2 Prioritization Frameworks Fueled by Customer Evidence
Adjust traditional prioritization scoring like RICE (Reach, Impact, Confidence, Effort) to account for ICP weighting and verified evidence scores.
$$\text{Prioritization Score} = \frac{\text{Reach} \times \text{Impact} \times \text{Evidence Confidence Score} \times \text{ICP Weight}}{\text{Effort}}$$
Where ICP Weight is defined as:
- 1.5: Request comes directly from Core Tier 1 ICP accounts.
- 1.0: Request comes from Secondary ICP accounts.
- 0.2: Request comes from Non-ICP accounts.
Portfolio Allocation Strategy
Maintain clear boundaries between operational feedback fixes and long-term vision bets:
- 60% Core Workflow Friction & Evidence-Backed Upgrades
(Optimizing existing workflows based on verified customer signals) - 30% Strategic Vision Bets & New Product Offerings
(Forward-looking initiatives directed by product strategy) - 10% Infrastructure, Tech Debt, and Operational Hygiene
(Scalability, security, and performance improvements)
4.3 Communicating the "Why" to Executive Stakeholders
When defending roadmap decisions to executive leaders, pair hard financial impact with real qualitative feedback:
- Quantify the Risk: "We have $420,000 in ARR across 12 Tier 1 accounts experiencing onboarding friction in this area."
- Show Real Friction: Play a 15-second video clip from a user research session showing an enterprise customer struggling with the interface.
- Present the Triangulated Fix: "Our telemetry shows a 32% drop-off at step two. This update addresses the precise friction point highlighted in the video clip, moving our retention metric directly."
5. Operationalizing Insight-Driven Culture Across Product Teams
5.1 Democratizing Customer Insights Without Losing Direction
To keep engineering, design, and product marketing aligned without overwhelming them with raw data, establish bi-weekly Customer Insight Demos.
- Format: 20-minute visual sync hosted every two weeks.
- Content:
- Show two high-impact qualitative insights from recent interviews.
- Display the telemetry data validating the problem.
- Share the resulting product decisions or upcoming design experiments.
- Rule: Focus on what was learned and how it altered the product team's roadmap priorities.
5.2 Closing the Loop with Customer-Facing Teams
Disconnects between Product, Sales, and Customer Success occur when GTM teams feel their input vanishes into a black hole. Close the loop systematically:
- Sales/CS Logs Input in Gong/Intercom
- PM Ingests & Tags with ICP/Evidence Metrics
- Opportunity Resolved or Feature Shipped
- Automated Alert Sent to Originating Rep with Release Details
When a feature ships or an opportunity area is resolved, use automated integrations to ping the sales rep or CS account manager who originally submitted the feedback. Equipping customer-facing teams with exact context turns internal friction into strategic cross-functional alignment.
6. Key Metrics to Track Your Feedback-to-Strategy Maturity
Track these operational and product metrics to evaluate how effectively your team converts raw feedback into strategic outcomes.
6.1 Operational Efficiency Metrics
- Insight Velocity: The average number of days it takes for raw feedback logged in Intercom/Gong to be categorized, tagged by ICP, and reviewed in an opportunity mapping session. Target: Under 5 business days.
- Discovery-to-Delivery Ratio: The percentage of shipped roadmap initiatives backed by an Evidence Confidence Score of 3 or higher. Target: Greater than 80%.
6.2 Product Impact Metrics
- ICP Adoption Rate: The 30-day adoption rate of new product releases specifically among Tier 1 ICP accounts compared to non-ICP cohorts.
- Opportunity Retention Lift: Month-over-month retention improvements in user cohorts that received specific evidence-backed workflow optimizations.
The 30-Day Leader Challenge
You do not need to overhaul your entire customer discovery infrastructure overnight. Take these three concrete steps over the next 30 days:
- Audit Your Feedback Ingest (Week 1): Take the last 50 customer requests logged in your tracking systems. Run them through an ICP filter. Categorize how many originated from Tier 1 target accounts versus non-ICP accounts.
- Run an Opportunity Mapping Session (Week 2): Select your primary product objective for the quarter. Map all active user requests related to that objective onto a single Opportunity Solution Tree. Group individual feature requests into broader strategic themes.
- Implement Evidence Confidence Scoring (Weeks 3–4): Add an Evidence Confidence Score (1–5) to every candidate item on your upcoming roadmap. Deprioritize any item scoring below 3 until your team gathers corroborating product analytics or additional target ICP research.
Level Up Your Product Craft
Building evidence-backed product strategies is a core focus at Product Leader Academy. If you are ready to master strategic prioritization, continuous discovery frameworks, and executive stakeholder alignment, apply for our flagship Product Leader Masterclass Program.
Tags
Related Articles
De-bias Your Discovery: The 3-Step Framework for Objective Insights
Stop running expensive validation exercises. Learn a 3-step framework to eliminate cognitive bias from product discovery and build what users actually want.
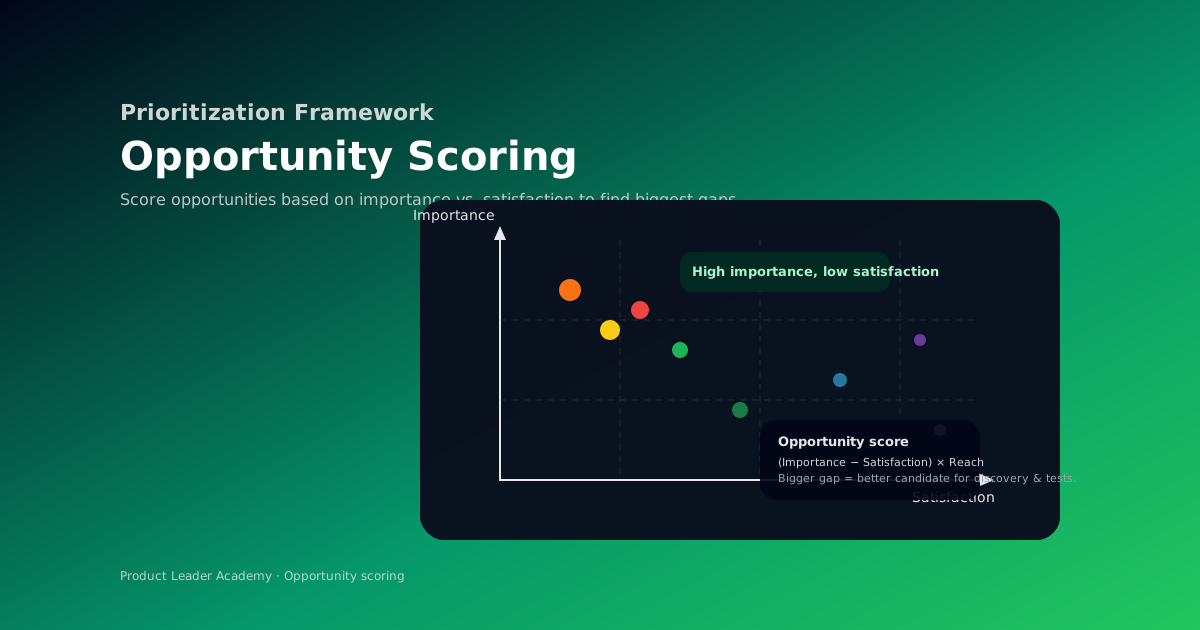
Opportunity Scoring: Finding Your Biggest Product Wins
Discover how to use Opportunity Scoring to identify high-value product improvements by measuring importance vs. satisfaction gaps.
Opportunity Scoring: Finding Your Biggest Product Wins
Discover how to use Opportunity Scoring to identify high-value product improvements by measuring importance vs. satisfaction gaps.